-
Predicting Failures with Condition Monitoring, Part 1
Predicting Failures with Condition Monitoring, Part 1
Many motors and pumps are critical in factory production; a functional failure might cause a complete line stop. To avoid this, there are usually extensive preventive maintenance plans in place that require work at regular intervals. These plans are based on lifetime statistics and not on the actual condition of the equipment.
If you know the condition of the equipment, you can reduce maintenance costs as well as the risk of an unexpected breakdown. Using this knowledge to schedule repair and replacement is called predictive maintenance.
The Process toward Failure
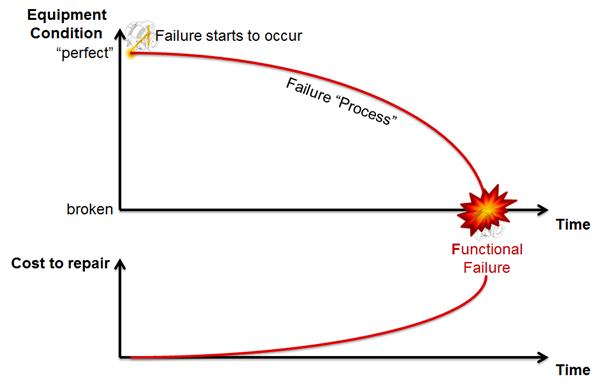
You can understand the condition of equipment because there is a process leading to its final functional failure (as illustrated in Figure 1). Usually, this failure process takes time (for example, think about wear or contamination as a source of failure).
 Figure 1 Failure Process and Cost to Repair
Early Indicators of Failure
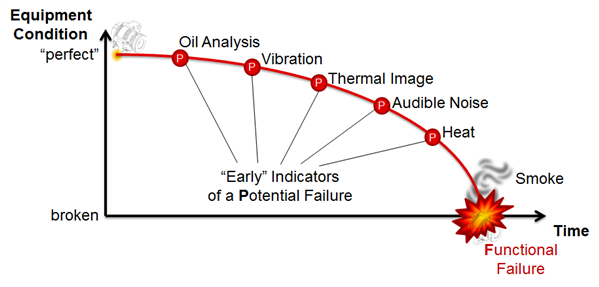
Fortunately, you do not have to wait until the equipment is broken – because there are early signs and signals that indicate a potential failure. The time from being able to detect a potential failure (P) until the actual functional failure (F) occurs is known as the P-F interval. Some indicators for motors with their corresponding P-F intervals that you can find in the literature include:
- Oil analysis (months).
- Vibration (weeks to months).
- Power (weeks to months)
- Thermal image (weeks).
- Audible noise (days to weeks).
- Heat (days).
Obviously, the earlier you can detect a potential failure, the more time you have to react, plan and execute equipment maintenance (Figure 2).
 Figure 2 P-F Curve – Potential Failure to Functional Failure
From Regular Inspections to Continuous Condition Monitoring
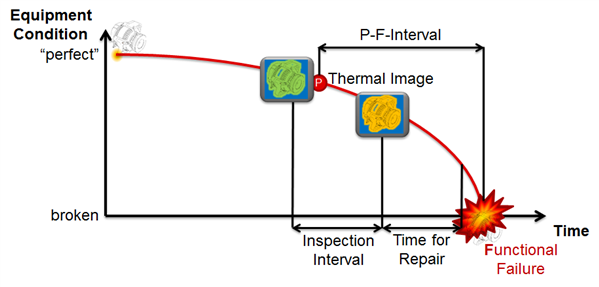
Another factor you must consider is the inspection interval: How often do you check for signs of potential failure? A longer inspection interval reduces the time you have to plan and execute the repair. In the worst case (as shown in Figure 3), you might have checked the condition just shortly before observing the potential failure, so when you detect the problem at the next inspection interval, the time to schedule and execute the repair is shorter than the P-F interval minus the inspection interval.
The best method would indicate a potential failure as early as possible while keeping the inspection intervals as short as possible; in other words, observing failure indicators continuously.
 Figure 3 Inspection Interval
Vibration Condition Monitoring
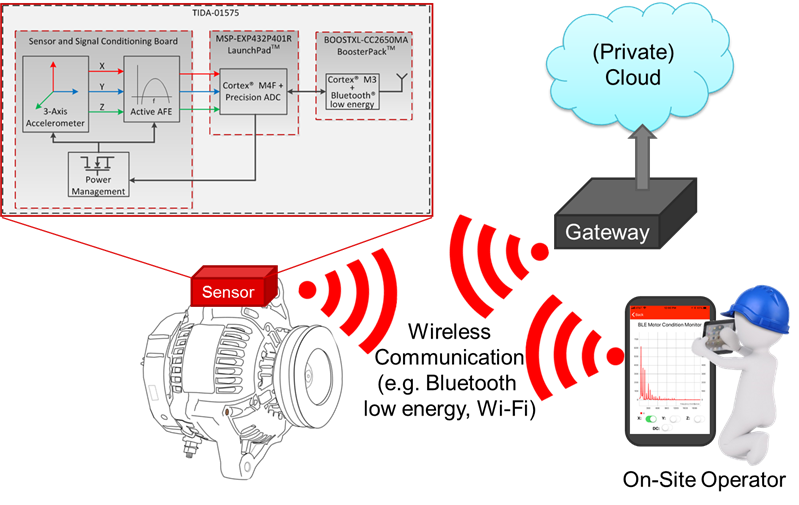
Changes in vibration are very early indicators for potential failure; in addition, it is simple to measure vibration continuously. The Reference Design for Wireless Condition Monitor for Motors and Pumps Using Multi-Axis Vibration is an example for such a vibration sensor. It uses an analog three-axis accelerometer that is measured by the precision analog-to-digital converter (ADC) in the MSP432P4. The measured data is processed in the sensor node by generating a fast Fourier transformation of it. The resulting frequency-domain data determines changes in the vibration patterns but also reduces the amount of data transmitted wirelessly via Bluetooth® low energy to a gateway, smartphone or tablet.
As shown in Figure 4 on-site operators can use the data from the sensor directly for diagnostics and troubleshooting. In the cloud, you can store the data and perform further analysis on the basis of previously captured data.
 Figure 4 Vibration Condition Monitoring Setup
Conclusion
Continuously monitoring the vibration of critical assets like motors and pumps in factories provides an early indication of a potential failure and enables you to plan the maintenance of equipment based on its actual condition, thus saving money. Adding a wireless sensor that pre-processes the data is an easy and low-cost way to add this functionality to motors and pumps.
Additional Resources
- Get up to speed on the MSP432P4’s integrated precision ADC by reading these application reports:
- “Low-Power Analog Measurements with SimpleLink™ MSP432™ Microcontrollers.”
- “Precision ADC with 16-Bit Performance.”
- The application reports “Leveraging Precision ADC on SimpleLink MSP432 Microcontrollers for Predictive Maintenance” and “Signal Processing with MSP432 Microcontroller and CMSIS-DSP Library” offer more details about the software that processes the measured data.
- To help you develop wireless connectivity solutions for the MSP432P4 host MCU, refer to the examples in the SimpleLink MSP432P4 Software Development Kit (SDK), the Bluetooth Plugin for SimpleLink MCU SDK and the SimpleLink WI-FI® CC3120 SDK Plugin.
- The Wireless Mesh Network for Predictive Maintenance Reference Design (TIDA-01439) provides an alternative RF technology and hardware platform for predictive maintenance.
IMPORTANT NOTICE AND DISCLAIMER
TI PROVIDES TECHNICAL AND RELIABILITY DATA (INCLUDING DATASHEETS), DESIGN RESOURCES (INCLUDING REFERENCE DESIGNS), APPLICATION OR OTHER DESIGN ADVICE, WEB TOOLS, SAFETY INFORMATION, AND OTHER RESOURCES “AS IS” AND WITH ALL FAULTS, AND DISCLAIMS ALL WARRANTIES, EXPRESS AND IMPLIED, INCLUDING WITHOUT LIMITATION ANY IMPLIED WARRANTIES OF MERCHANTABILITY, FITNESS FOR A PARTICULAR PURPOSE OR NON-INFRINGEMENT OF THIRD PARTY INTELLECTUAL PROPERTY RIGHTS.
These resources are intended for skilled developers designing with TI products. You are solely responsible for (1) selecting the appropriate TI products for your application, (2) designing, validating and testing your application, and (3) ensuring your application meets applicable standards, and any other safety, security, or other requirements. These resources are subject to change without notice. TI grants you permission to use these resources only for development of an application that uses the TI products described in the resource. Other reproduction and display of these resources is prohibited. No license is granted to any other TI intellectual property right or to any third party intellectual property right. TI disclaims responsibility for, and you will fully indemnify TI and its representatives against, any claims, damages, costs, losses, and liabilities arising out of your use of these resources.
TI’s products are provided subject to TI’s Terms of Sale (www.ti.com/legal/termsofsale.html) or other applicable terms available either on ti.com or provided in conjunction with such TI products. TI’s provision of these resources does not expand or otherwise alter TI’s applicable warranties or warranty disclaimers for TI products.
Mailing Address: Texas Instruments, Post Office Box 655303, Dallas, Texas 75265
Copyright © 2023, Texas Instruments Incorporated