• Menu
  • Product
  • Email
  • PDF
  • Order now
  • LM43603-Q1 3.5V 至 36V、3A 同步降压转换器

    • ZHCSDR3C April   2015  – October 2017 LM43603-Q1

      PRODUCTION DATA.  

  • CONTENTS
  • SEARCH
  • LM43603-Q1 3.5V 至 36V、3A 同步降压转换器
  1. 1 特性
  2. 2 应用
  3. 3 说明
  4. 4 修订历史记录
  5. 5 Pin Configuration and Functions
  6. 6 Specifications
    1. 6.1 Absolute Maximum Ratings
    2. 6.2 ESD Ratings
    3. 6.3 Recommended Operating Conditions
    4. 6.4 Thermal Information
    5. 6.5 Electrical Characteristics
    6. 6.6 Timing Requirements
    7. 6.7 Switching Characteristics
    8. 6.8 Typical Characteristics
  7. 7 Detailed Description
    1. 7.1 Overview
    2. 7.2 Functional Block Diagram
    3. 7.3 Feature Description
      1. 7.3.1  Fixed Frequency Peak Current Mode Controlled Step-Down Regulator
      2. 7.3.2  Light Load Operation
      3. 7.3.3  Adjustable Output Voltage
      4. 7.3.4  Enable (EN)
      5. 7.3.5  VCC, UVLO, and BIAS
      6. 7.3.6  Soft-Start and Voltage Tracking (SS/TRK)
      7. 7.3.7  Switching Frequency (RT) and Synchronization (SYNC)
      8. 7.3.8  Minimum ON Time, Minimum OFF Time and Frequency Foldback at Dropout Conditions
      9. 7.3.9  Internal Compensation and CFF
      10. 7.3.10 Bootstrap Voltage (BOOT)
      11. 7.3.11 Power Good (PGOOD)
      12. 7.3.12 Overcurrent and Short-Circuit Protection
      13. 7.3.13 Thermal Shutdown
    4. 7.4 Device Functional Modes
      1. 7.4.1 Shutdown Mode
      2. 7.4.2 Stand-by Mode
      3. 7.4.3 Active Mode
      4. 7.4.4 CCM Mode
      5. 7.4.5 Light Load Operation
      6. 7.4.6 Self-Bias Mode
  8. 8 Applications and Implementation
    1. 8.1 Application Information
    2. 8.2 Typical Applications
      1. 8.2.1 Design Requirements
      2. 8.2.2 Detailed Design Procedure
        1. 8.2.2.1  Custom Design With WEBENCH® Tools
        2. 8.2.2.2  Output Voltage Setpoint
        3. 8.2.2.3  Switching Frequency
        4. 8.2.2.4  Input Capacitors
        5. 8.2.2.5  Inductor Selection
        6. 8.2.2.6  Output Capacitor Selection
        7. 8.2.2.7  Feed-Forward Capacitor
        8. 8.2.2.8  Bootstrap Capacitors
        9. 8.2.2.9  VCC Capacitor
        10. 8.2.2.10 BIAS Capacitors
        11. 8.2.2.11 Soft-Start Capacitors
        12. 8.2.2.12 Undervoltage Lockout Setpoint
        13. 8.2.2.13 PGOOD
      3. 8.2.3 Application Performance Curves
  9. 9 Power Supply Recommendations
  10. 10Layout
    1. 10.1 Layout Guidelines
      1. 10.1.1 Compact Layout for EMI Reduction
      2. 10.1.2 Ground Plane and Thermal Considerations
      3. 10.1.3 Feedback Resistors
    2. 10.2 Layout Example
  11. 11器件和文档支持
    1. 11.1 器件支持
      1. 11.1.1 Third-Party Products Disclaimer
    2. 11.2 开发支持
      1. 11.2.1 使用 WEBENCH® 工具创建定制设计
    3. 11.3 接收文档更新通知
    4. 11.4 社区资源
    5. 11.5 静电放电警告
    6. 11.6 Glossary
  12. 12机械、封装和可订购信息
  13. 重要声明
search No matches found.
  • Full reading width
    • Full reading width
    • Comfortable reading width
    • Expanded reading width
  • Card for each section
  • Card with all content


DATA SHEET

LM43603-Q1 3.5V 至 36V、3A 同步降压转换器

本资源的原文使用英文撰写。 为方便起见,TI 提供了译文;由于翻译过程中可能使用了自动化工具,TI 不保证译文的准确性。 为确认准确性,请务必访问 ti.com 参考最新的英文版本(控制文档)。

1 特性

  • 符合汽车应用要求 认证
  • 具有符合 AEC-Q100 标准的下列结果:
    • 器件温度 1 级:–40°C 至 +125°C 的工作结温范围
  • 27µA 稳压静态电流
  • 可在轻负载条件下实现高效率(DCM 和 PFM)
  • 符合 EN55022/CISPR 22 电磁干扰 (EMI) 标准
  • 集成同步整流
  • 可调频率范围:200kHz 至 2.2MHz(默认值为 500kHz)
  • 与外部时钟频率同步
  • 内部补偿
  • 与陶瓷、固态电解、钽和铝电容器等大多数组合搭配使用时均可保持稳定
  • 电源正常标志
  • 软启动至预偏置负载
  • 内部软启动:4.1ms
  • 可由外部电容器延长的软启动时间
  • 输出电压跟踪功能
  • 程序系统欠压闭锁 (UVLO) 精确使能
  • 具有断续模式的输出短路保护
  • 过热关断保护
  • 使用 LM43603-Q1 并借助 WEBENCH® 电源设计器创建定制设计方案

2 应用

  • AM 以下波段汽车应用
  • 工业用电源
  • 通用宽 VIN 稳压
  • 高效负载点稳压
  • 电信系统

3 说明

LM43603-Q1 稳压器是一款易于使用的同步降压直流/直流转换器,能够驱动高达 3A 的负载电流,输入电压范围为 3.5V 至 36V(最大绝对值 42V)。LM43603-Q1 以极小的解决方案尺寸提供优异的效率、输出精度和压降电压。扩展系列产品能够以引脚到引脚兼容封装提供 0.5A、1A 和 2A 负载电流选项。采用峰值电流模式控制来实现简单控制环路补偿和逐周期电流限制。可选 功能 包括可编程开关频率、同步、电源正常标志、精确使能、内部软启动、可扩展软启动和跟踪,可为各种 应用提供灵活且易于使用的平台应用中对通道损失进行线性补偿。轻载时的断续传导和自动频率调制可提升轻载效率。此系列只需要很少的外部组件,并且引脚排列可实现简单、最优的印刷电路板 (PCB) 布局布线。保护功能 采用了 包括热关断、VCC 欠压锁定、逐周期电流限制和输出短路保护。LM43603-Q1 器件采用 HTSSOP (PWP) 16 引脚引线式封装 (6.6mm × 5.1mm × 1.2mm)。LM43603A-Q1 版本针对 PFM 操作进行优化,推荐用于新设计。该器件与 LM4360x 和 LM4600x 系列实现了引脚对引脚兼容。

器件信息

器件型号 封装 封装尺寸
LM43603-Q1 HTSSOP (16) 6.60mm × 5.10mm
LM43603A-Q1 HTTSOP (16) 6.60mm × 5.10mm


简化原理图

LM43603-Q1 sch_basic01_LM43603Q.png

辐射发射图
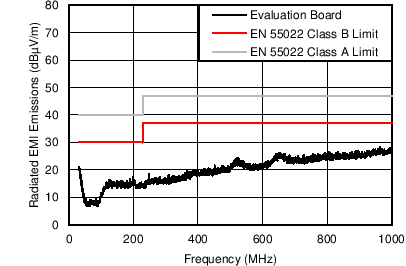
12 VIN 到 3.3 VOUT,FS = 500kHz,IOUT = 3A
LM43603-Q1 Rad_12VIN3p3V500k3AGr.png

4 修订历史记录

Changes from B Revision (April 2017) to C Revision

  • Added TI 参考设计的顶部导航图标Go
  • Changed MAX value for VBIAS rising threshold from "3.15" to "3.18" V Go

Changes from A Revision (May 2015) to B Revision

  • Added Webench 链接Go
  • Added LM43603A 器件信息Go
  • Added Maximum Operating Junction Temperature Go
  • Added standard FN1 to Thermal Information Go
  • Updating the RPGOOD value on EN = 3.3V and EN = 0V Go
  • Updating Figure 11 to match Figure 87 Go
  • Updating EN Falling Threshold CurveGo
  • Updating EN Rising Threshold Curve Go
  • Updating EN Hysteresis Curve Go
  • Changed Figure 33 into conducted EMI CurveGo
  • Replaced last few sentences of Application Information due to new Webench contentGo
  • Added Equation 25Go
  • Added Equation 26Go
  • Added Figure 73 to Figure 78. Application Performance Curves for VOUT = 5 V, Fs = 500 kHz. Go
  • Changed Figure 86Go
  • Changed Figure 87 Go

Changes from * Revision (April 2015) to A Revision

  • Changed 器件从产品预览改为量产数据 Go
  • Deleted “AM 以上波段”Go
  • Added "BIAS pin voltage should never exceed VIN" to BIAS pin descriptionGo
  • Added "of 10000 hours" to Ab Max FN 2Go
  • Changed info in Vfb rows; in ILKG-FB changed value of from FB=1.011 V to 1.015 VGo
  • Changed VFB = 1.011 V to VFB = 1.015 VGo

5 Pin Configuration and Functions

PWP Package
16-Pin HTSSOP
Top View
LM43603-Q1 po_01_snvsa13.gif

Pin Functions

PIN DESCRIPTION
NAME NO. TYPE(1)
SW 1, 2 P Switching output of the regulator. Internally connected to both power MOSFETs. Connect to power inductor.
CBOOT 3 P Boot-strap capacitor connection for high-side driver. Connect a high quality 470-nF capacitor from CBOOT to SW.
VCC 4 P Internal bias supply output for bypassing. Connect bypass capacitor from this pin to AGND. Do not connect external loading to this pin. Never short this pin to ground during operation.
BIAS 5 P Optional internal LDO supply input. To improve efficiency, TI recommends tying to VOUT when 3.3 V ≤ VOUT ≤ 28 V, or tie to an external 3.3 V or 5 V rail if available. When used, place a bypass capacitor (1 to 10 µF) from this pin to ground. Tie to ground when not in use. Do not float. BIAS pin voltage should never exceed VIN.
SYNC 6 A Clock input to synchronize switching action to an external clock. Use proper high-speed termination to prevent ringing. Connect to ground if not used. Do not float.
RT 7 A Connect a resistor RT from this pin to AGND to program switching frequency. Leave floating for 500 kHz default switching frequency.
PGOOD 8 A Open drain output for power-good flag. Use a 10-kΩ to 100-kΩ pullup resistor to logic rail or other DC voltage no higher than 12 V.
FB 9 A Feedback sense input pin. Connect to the midpoint of feedback divider to set VOUT. Do not short this pin to ground during operation.
AGND 10 G Analog ground pin. Ground reference for internal references and logic. Connect to system ground.
SS/TRK 11 A Soft-start control pin. Leave floating for internal soft-start slew rate. Connect to a capacitor to extend soft start time. Connect to external voltage ramp for tracking.
EN 12 A Enable input to the internal LDO and regulator. High = ON and low = OFF. Connect to VIN, or to VIN through resistor divider,or to an external voltage or logic source. Do not float.
VIN 13,14 P Supply input pins to internal LDO and high side power FET. Connect to power supply and bypass capacitors CIN. Path from VIN pin to high frequency bypass CIN and PGND must be as short as possible.
PGND 15,16 G Power ground pins, connected internally to the low side power FET. Connect to system ground, PAD, AGND, ground pins of CIN and COUT. Path to CIN must be as short as possible.
PAD - - Low impedance connection to AGND. Connect to PGND on PCB. Major heat dissipation path of the die. Must be used for heat sinking to ground plane on PCB.
(1) P = Power, G = Ground, A = Analog

6 Specifications

6.1 Absolute Maximum Ratings

over the recommended operating junction temperature (TJ) range of -40°C to +125°C(1)
PARAMETER MIN MAX UNIT
Input voltages VIN to PGND –0.3 42(2) V
EN to PGND –0.3 VIN + 0.3
FB, RT, SS/TRK to AGND –0.3 3.6
PGOOD to AGND –0.3 15
SYNC to AGND –0.3 5.5
BIAS to AGND –0.3 30 or VIN(3)
AGND to PGND –0.3 0.3
Output voltages SW to PGND –0.3 VIN + 0.3 V
SW to PGND less than 10-ns transients –3.5 42
CBOOT to SW –0.3 5.5
VCC to AGND –0.3 3.6
Storage temperature, Tstg –65 150 °C
Operating junction temperature –40 150 °C
(1) Stresses beyond those listed under Absolute Maximum Ratings may cause permanent damage to the device. These are stress ratings only, and functional operation of the device at these or any other conditions beyond those indicated under Recommended Operating Conditions is not implied. Exposure to absolute-maximum-rated conditions for extended periods may affect device reliability.
(2) At maximum duty cycle 0.01%
(3) Whichever is lower

6.2 ESD Ratings

VALUE UNIT
V(ESD) Electrostatic discharge Human-body model (HBM), per AEC Q100-002(1) ±2000 V
Charged-device model (CDM), per AEC Q100-011 ±750
(1) AEC Q100-002 indicates that HBM stressing shall be in accordance with the ANSI/ESDA/JEDEC JS-001 specification.

6.3 Recommended Operating Conditions

over the recommended operating junction temperature (TJ) range of –40°C to +125°C (1)
PARAMETER MIN MAX UNIT
Input voltages VIN to PGND 3.5 36 V
EN –0.3 VIN
FB –0.3 1.1
PGOOD –0.3 12
BIAS input not used –0.3 0.3
BIAS input used 3.3 28 or VIN (2)
AGND to PGND –0.1 0.1
Output voltage VOUT 1 28 V
Output current IOUT 0 3 A
Temperature Operating junction temperature, TJ –40 125 °C
(1) Recommended Operating Conditions indicates conditions for which the device is intended to be functional, but do not ensure specific performance limits. For verified specifications, see Electrical Characteristics.
(2) Whichever is lower.

6.4 Thermal Information

THERMAL METRIC(1)(2)(3) LM43603-Q1 UNIT
PWP (HTSSOP)
16 PINS
RθJA Junction-to-ambient thermal resistance 38.9(4) °C/W
RθJC (Top) Junction-to-case (top) thermal resistance 24.3 °C/W
RθJB Junction-to-board thermal resistance 19.9 °C/W
ψJT Junction-to-top characterization parameter 0.7 °C/W
ψJB Junction-to-board characterization parameter 19.7 °C/W
RθJC(bot) Junction-to-case (bottom) thermal resistance 1.7 °C/W
(1) For more information about traditional and new thermal metrics, see the Semiconductor and IC Package Thermal Metrics application report.
(2) The package thermal impedance is calculated in accordance with JESD 51-7;
(3) Thermal resistances were simulated on a 4 layer, JEDEC board.
(4) See Figure 98 for RθJA vs Copper Area Curve

6.5 Electrical Characteristics

Limits apply over the recommended operating junction temperature (TJ) range of –40°C to +125°C, unless otherwise stated. Minimum and Maximum limits are specified through test, design or statistical correlation. Typical values represent the most likely parametric norm at TJ = 25°C, and are provided for reference purposes only. Unless otherwise stated, the following conditions apply: VIN = 12 V, VOUT = 3.3 V, FS = 500 kHz.
PARAMETER CONDITIONS MIN TYP MAX UNIT
SUPPLY VOLTAGE (VIN PIN)
VIN-MIN-ST Minimum input voltage for start-up 3.8 V
ISHDN Shutdown quiescent current VEN = 0 V 1.2 3.1 µA
IQ-NONSW Operating quiescent current (non-switching) from VIN VEN = 3.3 V
VFB = 1.5 V
VBIAS = 3.4 V external
5 10 µA
IBIAS-NONSW Operating quiescent current (non-switching) from external VBIAS VEN = 3.3 V
VFB = 1.5 V
VBIAS = 3.4 V external
85 130 µA
IQ-SW Operating quiescent current (switching) VEN = 3.3 V
IOUT = 0 A
RT = open
VBIAS = VOUT = 3.3 V
RFBT = 1 Meg
27 µA
ENABLE (EN PIN)
VEN-VCC-H Voltage level to enable the internal LDO output VCC VENABLE high level 1.2 V
VEN-VCC-L Voltage level to disable the internal LDO output VCC VENABLE low level 0.525 V
VEN-VOUT-H Precision enable level for switching and regulator output: VOUT VENABLE high level 2 2.20 2.42 V
VEN-VOUT-HYS Hysteresis voltage between VOUT precision enable and disable thresholds VENABLE hysteresis –290 mV
ILKG-EN Enable input leakage current VEN = 3.3 V 0.85 1.75 µA
INTERNAL LDO (VCC and BIAS PINS)
VCC Internal LDO output voltage VCC VIN ≥ 3.8 V 3.28 V
VCC-UVLO Undervoltage lockout (UVLO) thresholds for VCC VCC rising threshold 3.1 V
Hysteresis voltage between rising and falling thresholds –520 mV
VBIAS-ON Internal LDO input change over threshold to BIAS VBIAS rising threshold 2.94 3.18 V
Hysteresis voltage between rising and falling thresholds -75 mV
VOLTAGE REFERENCE (FB PIN)
VFB Feedback voltage TJ = 25 ºC 1.012 1.015 1.019 V
TJ = -40 ºC to 125 ºC 0.999 1.015 1.032
ILKG-FB Input leakage current at FB pin FB = 1.015 V 0.2 65 nA
THERMAL SHUTDOWN
TSD (1) Thermal shutdown Shutdown threshold 160 ºC
Recovery threshold 150 ºC
CURRENT LIMIT AND HICCUP
IHS-LIMIT Peak inductor current limit 4.4 5.5 6.4 A
ILS-LIMIT Inductor current valley limit 2.6 3 3.3 A
SOFT START (SS/TRK PIN)
ISSC Soft-start charge current 1.25 2 2.75 µA
RSSD Soft-start discharge resistance UVLO, TSD, OCP, or EN = 0 V 18 kΩ
POWER GOOD (PGOOD PIN)
VPGOOD-HIGH Power-good flag over voltage tripping threshold % of FB voltage 110% 113%
VPGOOD-LOW Power-good flag under voltage tripping threshold % of FB voltage 77% 88%
VPGOOD-HYS Power-good flag recovery hysteresis % of FB voltage 6%
RPGOOD PGOOD pin pulldown resistance when power bad VEN = 3.3 V 69 150 Ω
VEN = 0 V 150 350
MOSFETS (2)
RDS-ON-HS High-side MOSFET ON-resistance IOUT = 1 A
VBIAS = VOUT = 3.3 V
120 mΩ
RDS-ON-LS Low-side MOSFET ON-resistance IOUT = 1 A
VBIAS = VOUT = 3.3 V
65 mΩ
(1) Ensured by design
(2) Measured at pins

6.6 Timing Requirements

MIN NOM MAX UNIT
CURRENT LIMIT AND HICCUP
NOC Hiccup wait cycles when LS current limit tripped 32 Cycles
TOC Hiccup retry delay time 5.5 ms
SOFT START (SS/TRK PIN)
TSS Internal soft-start time when SS pin open circuit 4.1 ms
POWER GOOD (PGOOD PIN)
TPGOOD-RISE Power-good flag rising transition deglitch delay 220 µs
TPGOOD-FALL Power-good flag falling transition deglitch delay 220 µs

6.7 Switching Characteristics

Limits apply over the recommended operating junction temperature (TJ) range of –40°C to +125°C, unless otherwise stated. Minimum and Maximum limits are specified through test, design or statistical correlation. Typical values represent the most likely parametric norm at TJ = 25°C, and are provided for reference purposes only. Unless otherwise stated, the following conditions apply: VIN = 12 V, VOUT = 3.3 V, FS = 500 kHz.
PARAMETER TEST CONDITIONS MIN TYP MAX UNIT
SW (SW PIN)
tON-MIN(1) Minimum high side MOSFET ON time 125 165 ns
tOFF-MIN(1) Minimum high side MOSFET OFF time 200 250 ns
OSCILLATOR (SW and SYNC PINS)
FOSC-DEFAULT Oscillator default frequency RT pin open circuit 425 500 580 kHz
FADJ Minimum adjustable frequency With 1% resistors at RT pin 200 kHz
Maximum adjustable frequency 2200 kHz
Frequency adjust accuracy 10%
VSYNC-HIGH Sync clock high level threshold 2 V
VSYNC-LOW Sync clock low level threshold 0.4 V
DSYNC-MAX Sync clock maximum duty cycle 90%
DSYNC-MIN Sync clock minimum duty cycle 10%
TSYNC-MIN Mininum sync clock ON and OFF time 80 ns
(1) Ensured by design

6.8 Typical Characteristics

Unless otherwise specified, VIN = 12 V, VOUT = 3.3 V, FS = 500 kHz, L = 6.8 µH and room temperature. See Application Performance Curves for bill of materials for other VOUT and FS combinations.
LM43603-Q1 3p3V_500k_Eff_Gr.png
VOUT = 3.3 V FS = 500 kHz
Figure 1. Efficiency
LM43603-Q1 5V_500k_Eff_Gr.png
VOUT = 5 V FS = 500 kHz
Figure 3. Efficiency
LM43603-Q1 5V_2M_Eff_Gr.png
VOUT = 5 V FS = 2.2 MHz
Figure 5. Efficiency
LM43603-Q1 3p3_500k_Reg_Gr.png
VOUT = 3.3V FS = 500 kHz
Figure 7. VOUT Regulation
LM43603-Q1 5V_500k_Reg_Gr.png
VOUT = 5 V FS = 500 kHz
Figure 9. VOUT Regulation
LM43603-Q1 5V_2M_Reg_Gr_Update.png
VOUT = 5 V FS = 2.2 MHz
Figure 11. VOUT Regulation
LM43603-Q1 3p3V_500k_Drop_Gr.png
VOUT = 3.3 V FS = 500 kHz
Figure 13. Dropout Curve
LM43603-Q1 5V_500k_Drop_Gr.png
VOUT = 5 V FS = 500 kHz
Figure 15. Dropout Curve
LM43603-Q1 5V_2M_Drop_Gr.png
VOUT = 5 V FS = 2.2 MHz
Figure 17. Dropout Curve
LM43603-Q1 EN_DOWN.png Figure 19. EN Falling Threshold
LM43603-Q1 EN_Hyst.png Figure 21. EN Hysteresis
LM43603-Q1 HSRDSON.png Figure 23. High-Side FET On Resistance vs Junction Temperature
LM43603-Q1 HSILIM.png Figure 25. High-Side Current Limit vs Junction Temperature
LM43603-Q1 PGOVPUP.png Figure 27. PGOOD OVP Falling Threshold vs Junction Temperature
LM43603-Q1 PGUVPDWN.png Figure 29. PGOOD UVP Falling Threshold vs Junction Temperature
LM43603-Q1 Rad_12VIN3p3V500k3AGr.png
VOUT = 3.3 V FS = 500 kHz IOUT = 3 A
Figure 31. Radiated EMI Curve
LM43603-Q1 Con_12VIN3p3V500k3AGr.png
VOUT = 3.3 V FS = 500 kHz IOUT = 3 A
Cd = 47 µF Lin = 1 µH CIN4 = 68 µF
Figure 33. Conducted EMI Curve
LM43603-Q1 5V_200k_Eff_Gr.png
VOUT = 5V FS = 200 kHz
Figure 2. Efficiency
LM43603-Q1 5V_1M_Eff_Gr.png
VOUT = 5 V FS = 1 MHz
Figure 4. Efficiency
LM43603-Q1 12V_500k_Eff_Gr.png
VOUT = 12 V FS = 500 kHz
Figure 6. Efficiency
LM43603-Q1 5V_200k_Reg_Gr.png
VOUT = 5 V FS = 200 kHz
Figure 8. VOUT Regulation
LM43603-Q1 5V_1M_Reg_Gr.png
VOUT = 5 V FS = 1 MHz
Figure 10. VOUT Regulation
LM43603-Q1 12V_500k_Reg_Gr.png
VOUT = 12 V FS = 500 kHz
Figure 12. VOUT Regulation
LM43603-Q1 5V_200k_Drop_Gr.png
VOUT = 5 V FS = 200 kHz
Figure 14. Dropout Curve
LM43603-Q1 5V_1M_Drop_Gr.png
VOUT = 5 V FS = 1 MHz
Figure 16. Dropout Curve
LM43603-Q1 12V_500k_Drop_Gr.png
VOUT = 12 V FS = 500 kHz
Figure 18. Dropout Curve
LM43603-Q1 EN_UP.png Figure 20. EN Rising Threshold
LM43603-Q1 VFB.png Figure 22. FB Voltage vs Junction Temperature
LM43603-Q1 LSRDSON.png Figure 24. Low-Side FET On Resistance vs Junction Temperature
LM43603-Q1 LSILIM.png Figure 26. Low-Side Current Limit vs Junction Temperature
LM43603-Q1 PGOVPDOWN.png Figure 28. PGOOD OVP Rising Threshold vs Junction Temperature
LM43603-Q1 PGUVPUP.png Figure 30. PGOOD UVP Rising Threshold vs Junction Temperature
LM43603-Q1 Rad_12VIN5V500k3AGr.png
VOUT = 5 V FS = 500 kHz IOUT = 3 A
Figure 32. Radiated EMI Curve
LM43603-Q1 Con_12VIN5V500k3AGr.png
VOUT = 5 V FS = 500 kHz IOUT = 3 A
Cd = 47 µF Lin = 1 µH CIN4 = 68 µF
Figure 34. Conducted EMI Curve

7 Detailed Description

7.1 Overview

The LM43603-Q1 regulator is an easy-to-use synchronous step-down DC-DC converter that operates from 3.5 V to 36 V supply voltage. It is capable of delivering up to 3-A DC load current with exceptional efficiency and thermal performance in a very small solution size. An extended family is available in 0.5-A, 1-A, and 2-A load options in pin-to-pin compatible packages.

The LM43603-Q1 employs fixed frequency peak current mode control with discontinuous conduction mode (DCM) and pulse frequency modulation (PFM) mode at light load to achieve high efficiency across the load range. The device is internally compensated, which reduces design time, and requires fewer external components. The switching frequency is programmable from 200 kHz to 2.2 MHz by an external resistor RT. It is default at 500 kHz without RT resistor. The LM43603-Q1 is also capable of synchronization to an external clock within the 200 kHz to 2.2 MHz frequency range. The wide switching frequency range allows the device to be optimized to fit small board space at higher frequency, or high efficient power conversion at lower frequency.

Optional features are included for more comprehensive system requirements, including power-good (PGOOD) flag, precision enable, synchronization to external clock, extendable soft-start time, and output voltage tracking. These features provide a flexible and easy to use platform for a wide range of applications. Protection features include over temperature shutdown, VCC undervoltage lockout (UVLO), cycle-by-cycle current limit, and short-circuit protection with hiccup mode.

The LM4360x family requires few external components, and the pin arrangement was designed for simple, optimum PCB layout. The LM43603-Q1 device is available in the HTSSOP (PWP) 16-pin leaded package.

7.2 Functional Block Diagram

LM43603-Q1 bd_snvsa13.gif

7.3 Feature Description

7.3.1 Fixed Frequency Peak Current Mode Controlled Step-Down Regulator

The following operating description of the LM43603-Q1 refers to the Functional Block Diagram and to the waveforms in Figure 35. The LM43603-Q1 is a step-down buck regulator with both a high-side (HS) and low-side (LS) switch integrated into the device. The LM43603-Q1 supplies a regulated output voltage by turning on the HS and LS NMOS switches with controlled ON time. During the HS switch ON time, the SW pin voltage VSW swings up to approximately VIN, and the inductor current iL increases with a linear slope (VIN – VOUT) / L. When the HS switch is turned off by the control logic, the LS switch is turned on after a anti-shoot-through dead time. Inductor current discharges through the LS switch with a slope of –VOUT / L. The control parameter of buck converters are defined as duty cycle D = tON / TSW, where tON is the HS switch ON time and TSW is the switching period. The regulator control loop maintains a constant output voltage by adjusting the duty cycle D. In an ideal buck converter, where losses are ignored, D is proportional to the output voltage and inversely proportional to the input voltage: D = VOUT / VIN.

LM43603-Q1 SW_inductor_wvfrm_CCM_snvsa13.gif Figure 35. SW Node and Inductor Current Waveforms in Continuous Conduction Mode (CCM)

The LM43603-Q1 synchronous buck converter employs peak current mode control topology. A voltage feedback loop is used to get accurate DC voltage regulation by adjusting the peak current command based on voltage offset. The peak inductor current is sensed from the HS switch and compared to the peak current to control the ON time of the HS switch. The voltage feedback loop is internally compensated, which allows for fewer external components, makes it easy to design, and provides stable operation with almost any combination of output capacitors. The regulator operates with fixed switching frequency in CCM and DCM. At very light load, the LM43603-Q1 operates in PFM to maintain high efficiency and the switching frequency decreases with reduced load current.

7.3.2 Light Load Operation

DCM operation is employed in the LM43603-Q1 when the inductor current valley reaches zero. The LM43603-Q1 is in DCM when load current is less than half of the peak-to-peak inductor current ripple in CCM. In DCM, the LS switch is turned off when the inductor current reaches zero. Switching loss is reduced by turning off the LS FET at zero current, and the conduction loss is lowered by not allowing negative current conduction. Power conversion efficiency is higher in DCM than CCM under the same conditions.

In DCM, the HS switch ON time reduces with lower load current. When either the minimum HS switch ON time (tON-MIN) or the minimum peak inductor current (IPEAK-MIN) is reached, the switching frequency decreases to maintain regulation. At this point, the LM43603-Q1 operates in PFM. In PFM, switching frequency is decreased by the control loop when load current reduces to maintain output voltage regulation. Switching loss is further reduced in PFM operation due to less frequent switching actions.

In PFM operation, a small positive DC offset is required at the output voltage to activate the PFM detector. The lower the frequency in PFM, the more DC offset is needed at VOUT. Refer to the Typical Characteristics for typical DC offset at very light load. If the DC offset on VOUT is not acceptable for a given application, a static load at output is recommended to reduce or eliminate the offset. Lowering values of the feedback divider RFBT and RFBB can also serve as a static load. In conditions with low VIN and/or high frequency, the LM43603-Q1 may not enter PFM mode if the output voltage cannot be charged up to provide the trigger to activate the PFM detector. Once the LM43603-Q1 is operating in PFM mode at higher VIN, it remains in PFM operation when VIN is reduced. See Figure 45 for a sample of PFM operation.

7.3.3 Adjustable Output Voltage

The voltage regulation loop in the LM43603-Q1 regulates output voltage by maintaining the voltage on FB pin (VFB) to be the same as the internal REF voltage (VREF). A resistor divider pair is needed to program the ratio from output voltage VOUT to VFB. The resistor divider is connected from the VOUT of the LM43603-Q1 to ground with the mid-point connecting to the FB pin.

LM43603-Q1 output_volt_set_snvsa13.gif Figure 36. Output Voltage Setting

The voltage reference system produces a precise voltage reference over temperature. The internal REF voltage is 1.011 V typically. To program the output voltage of the LM43603-Q1 to be a certain value VOUT, RFBB can be calculated with a selected RFBT by Equation 1:

Equation 1. LM43603-Q1 eq01_snvsa13.gif

The choice of the RFBT depends on the application. TI recommends RFBT in the range from 10 kΩ to 100 kΩ for most applications. A lower RFBT value can be used if static loading is desired to reduce VOUT offset in PFM operation. Lower RFBT reduces efficiency at very light load. Less static current goes through a larger RFBT and might be more desirable when light load efficiency is critical. But RFBT larger than 1 MΩ is not recommended because it makes the feedback path more susceptible to noise. Larger RFBT value requires more carefully designed feedback path on the PCB. The tolerance and temperature variation of the resistor dividers affect the output voltage regulation. TI recommends using divider resistors with 1% tolerance or better and temperature coefficient of 100 ppm or lower.

If the resistor divider is not connected properly, output voltage cannot be regulated because the feedback loop is broken. If the FB pin is shorted to ground, the output voltage is driven close to VIN, because the regulator sees very low voltage on the FB pin and tries to regulator it up. The load connected to the output could be damaged under such a condition. Do not short FB pin to ground when the LM43603-Q1 is enabled. It is important to route the feedback trace away from the noisy area of the PCB. For more layout recommendations, see the Layout section.

7.3.4 Enable (EN)

Voltage on the EN pin (VEN) controls the ON or OFF operation of the LM43603-Q1. Applying a voltage less than 0.4 V to the EN input shuts down the operation of the LM43603-Q1. In shutdown mode the quiescent current drops to typically 1.2 µA at VIN = 12 V.

The internal LDO output voltage VCC is turned on when VEN is higher than 1.2 V. Switching action and output regulation are enabled when VEN is greater than 2.1 V (typical). The LM43603-Q1 supplies regulated output voltage when enabled and output current up to 3 A.

The EN pin is an input and cannot be open circuit or floating. The simplest way to enable the operation of the LM43603-Q1 is to connect the EN pin to VIN pins directly. This allows self-start-up when VIN is within the operation range.

Many applications benefit from use of an enable divider RENT and RENB in Figure 37 to establish a precision system UVLO level for the stage. System UVLO can be used for supplies operating from utility power as well as battery power. It can be used for sequencing, ensuring reliable operation, or supply protection, such as a battery discharge level. An external logic signal can also be used to drive EN input for system sequencing and protection.

LM43603-Q1 vin_uvlo_snvsa13.gif Figure 37. System UVLO by Enable Dividers

7.3.5 VCC, UVLO, and BIAS

The LM43603-Q1 integrates an internal LDO to generate VCC for control circuitry and MOSFET drivers. The nominal voltage for VCC is 3.28 V. The VCC pin is the output of the LDO must be properly bypassed. Place a high-quality ceramic capacitor with 2.2-µF to 10-µF capacitance and 6.3 V or higher rated voltage as possible to VCC and grounded to the exposed PAD and ground pins. The VCC output pin must not be loaded, left floating, or shorted to ground during operation. Shorting VCC to ground during operation may cause damage to the LM43603-Q1.

Undervoltage lockout (UVLO) prevents the LM43603-Q1 from operating until the VCC voltage exceeds 3.1 V (typical). The VCC UVLO threshold has 520 mV of hysteresis (typically) to prevent undesired shuting down due to temporary VIN droops.

The internal LDO has two inputs: primary from VIN and secondary from BIAS input. The BIAS input powers the LDO when VBIAS is higher than the change-over threshold. Power loss of an LDO is calculated by ILDO × (VIN-LDO – VOUT-LDO). The higher the difference between the input and output voltages of the LDO, the more power loss occur to supply the same output current. The BIAS input is designed to reduce the difference of the input and output voltages of the LDO to reduce power loss and improve LM43603-Q1 efficiency, especially at light load. It is recommended to tie the BIAS pin to VOUT when VOUT ≥ 3.3 V. Ground the BIAS pin in applications with VOUT less than 3.3 V. BIAS input can also come from an external voltage source, if available, to reduce power loss. When used, TI recommends a 1-µF to 10-µF high-quality ceramic capacitor to bypass the BIAS pin to ground.

7.3.6 Soft-Start and Voltage Tracking (SS/TRK)

The LM43603-Q1 has a flexible and easy-to-use start-up rate control pin: SS/TRK. Soft-start feature is to prevent inrush current impacting the LM43603-Q1 and its supply when power is first applied. Soft start is achieved by slowly ramping up the target regulation voltage when the device is first enabled or powered up.

The simplest way to use the part is to leave the SS/TRK pin open circuit or floating. The LM43603-Q1 employs the internal soft-start control ramp and starts up to the regulated output voltage in 4.1 ms typically.

In applications with a large amount of output capacitors, or higher VOUT, or other special requirements the soft-start time can be extended by connecting an external capacitor CSS from SS/TRK pin to AGND. Extended soft-start time further reduces the supply current needed to charge up output capacitors and supply any output loading. An internal current source (ISSC = 2 µA) charges CSS and generates a ramp from 0 V to VFB to control the ramp-up rate of the output voltage. For a desired soft start time tSS, the capacitance for CSS can be found with Equation 2:

Equation 2. LM43603-Q1 eq02_snvsa13.gif

The LM43603-Q1 is capable of starting up into prebiased output conditions. When the inductor current reaches zero, the LS switch is turned off to avoid negative current conduction. This operation mode is also called diode emulation mode. It is built-in by the DCM operation in light loads. With a prebiased output voltage, the LM43603-Q1 waits until the soft-start ramp allows regulation above the prebiased voltage and then follows the soft-start ramp to the regulation level.

When an external voltage ramp is applied to the SS/TRK pin, the LM43603-Q1 FB voltage follows the ramp if the ramp magnitude is lower than the internal soft-start ramp. A resistor divider pair can be used on the external control ramp to the SS/TRK pin to program the tracking rate of the output voltage. The final voltage seen by the SS/TRK pin should not fall below 1.2 V to avoid abnormal operation.

LM43603-Q1 soft_start_track_snvsa13.gif Figure 38. Soft Start Tracking External Ramp

VOUT tracked to external voltage ramps has options of ramping up slower or faster than the internal voltage ramp. VFB always follows the lower potential of the internal voltage ramp and the voltage on the SS/TRK pin. Figure 39 shows the case when VOUT ramps slower than the internal ramp, while Figure 40 shows when VOUT ramps faster than the internal ramp. Faster start-up time may result in inductor current tripping current protection during start-up. Use with special care.

LM43603-Q1 tracking_slow_snvsa13.gif Figure 39. Tracking with Longer Start-up Time than the Internal Ramp
LM43603-Q1 tracking_fast_snvsa13.gif Figure 40. Tracking with Shorter Start-up Time than the Internal Ramp

7.3.7 Switching Frequency (RT) and Synchronization (SYNC)

The switching frequency of the LM43603-Q1 can be programmed by the impedance RT from the RT pin to ground. The frequency is inversely proportional to the RT resistance. The RT pin can be left floating, and the LM43603-Q1 operates at 500-kHz default switching frequency. The RT pin is not designed to be shorted to ground. For a desired frequency, typical RT resistance can be found by Equation 3. Table 1 gives typical RT values for a given FS.

Equation 3. RT(kΩ) = 40200 / Freq (kHz) – 0.6
LM43603-Q1 Rt_Fs_Curve.png Figure 41. RT vs Frequency Curve

Table 1. Typical Frequency Setting RT Resistance

FS (kHz) RT (kΩ)
200 200
350 115
500 78.7
750 53.6
1000 39.2
1500 26.1
2000 19.6
2200 17.8

The LM43603-Q1 switching action can also be synchronized to an external clock from 200 kHz to 2.2 MHz. Connect an external clock to the SYNC pin, with proper high-speed termination, to avoid ringing. Ground the SYNC pin if not used.

LM43603-Q1 freq_sync_snvsa13.gif Figure 42. Frequency Synchronization

The recommendations for the external clock include high level no lower than 2 V, low level no higher than 0.4 V, duty cycle between 10% and 90%, and both positive and negative pulse width no shorter than 80 ns. When the external clock fails at logic high or low, the LM43603-Q1 switches at the frequency programmed by the RT resistor after a time-out period. TI recommends connecting a resistor RT to the RT pin so that the internal oscillator frequency is the same as the target clock frequency when the LM43603-Q1 is synchronized to an external clock. This allows the regulator to continue operating at approximately the same switching frequency if the external clock fails.

The choice of switching frequency is usually a compromise between conversion efficiency and the size of the circuit. Lower switching frequency implies reduced switching losses (including gate charge losses, switch transition losses, etc.) and usually results in higher overall efficiency. However, higher switching frequency allows use of smaller LC output filters and hence a more compact design. Lower inductance also helps transient response (higher large signal slew rate of inductor current), and reduces the DCR loss. The optimal switching frequency is usually a trade-off in a given application and thus needs to be determined on a case-by-case basis. It is related to the input voltage, output voltage, most frequent load current level(s), external component choices, and circuit size requirement. The choice of switching frequency may also be limited if an operating condition triggers TON-MIN or TOFF-MIN.

7.3.8 Minimum ON Time, Minimum OFF Time and Frequency Foldback at Dropout Conditions

Minimum ON time, TON-MIN, is the smallest duration of time that the HS switch can be on. TON-MIN value is typically 125 ns in the LM43603-Q1. Minimum OFF time, TOFF-MIN, is the smallest duration that the HS switch can be off. TOFF-MIN value is typically 200 ns in the LM43603-Q1.

In CCM operation, TON-MIN and TOFF-MIN limits the voltage conversion range given a selected switching frequency. The minimum duty cycle allowed is:

Equation 4. DMIN = TON-MIN × FS

And the maximum duty cycle allowed is:

Equation 5. DMAX = 1 – TOFF-MIN × FS

Given fixed TON-MIN and TOFF-MIN, the higher the switching frequency the narrower the range of the allowed duty cycle. In the LM43603-Q1, frequency foldback scheme is employed to extend the maximum duty cycle when TOFF-MIN is reached. The switching frequency decreases once longer duty cycle is needed under low VIN conditions. The switching frequency can be decreased to approximately 1/10 of the programmed frequency by RT or the synchronization clock. Such wide range of frequency foldback allows the LM43603-Q1 output voltage stay in regulation with a much lower supply voltage VIN. This leads to a lower effective dropout voltage. See Typical Characteristics for more details.

Given an output voltage, the choice of the switching frequency affects the allowed input voltage range, solution size and efficiency. The maximum operatable supply voltage can be found by:

Equation 6. VIN-MAX = VOUT / (FS × TON-MIN)

At lower supply voltage, the switching frequency decreases once TOFF-MIN is tripped. The minimum VIN without frequency foldback can be approximated by Equation 7:

Equation 7. VIN-MIN = VOUT / (1 – FS × TOFF-MIN)

Taking considerations of power losses in the system with heavy load operation, VIN-MIN is higher than the result calculated in Equation 7. With frequency foldback, VIN-MIN is lowered by decreased FS.

LM43603-Q1 5V_500k_FreqDrop_Gr.png Figure 43. VOUT = 5 V Fs = 500 kHz
Frequency Foldback at Dropout

7.3.9 Internal Compensation and CFF

The LM43603-Q1 is internally compensated with RC = 400 kΩ and CC = 50 pF as shown in Functional Block Diagram. The internal compensation is designed such that the loop response is stable over the entire operating frequency and output voltage range. Depending on the output voltage, the compensation loop phase margin can be low with all ceramic capacitors. TI recommends an external feed-forward capacitor, CFF, be placed in parallel with the top resistor divider RFBT for optimum transient performance.

LM43603-Q1 feedfwd_capacitor_snvsa13.gif Figure 44. Feed-Forward Capacitor for Loop Compensation

The feed-forward capacitor CFF in parallel with RFBT places an additional zero before the cross over frequency of the control loop to boost phase margin. The zero frequency can be found with Equation 8:

Equation 8. fZ-CFF = 1 / (2π × RFBT × CFF).

An additional pole is also introduced with CFF at the frequency of

Equation 9. fP-CFF = 1 / (2π × CFF × (RFBT // RFBB)).

Select the CFF so that the bandwidth of the control loop without the CFF is centered between fZ-CFF and fP-CFF. The zero fZ-CFF adds phase boost at the crossover frequency and improves transient response. The pole fP-CFF helps maintaining proper gain margin at frequency beyond the crossover.

Designs with different combinations of output capacitors need different CFF. Different types of capacitors have different equivalent series resistance (ESR). Ceramic capacitors have the smallest ESR and need the most CFF. Electrolytic capacitors have much larger ESR

Equation 10. fZ-ESR = 1 / (2π × ESR × COUT)

and the ESR zero frequency would be low enough to boost the phase up around the crossover frequency. Designs using mostly electrolytic capacitors at the output may not need any CFF.

The CFF creates a time constant with RFBT that couples in the attenuated output voltage ripple to the FB node. If the CFF value is too large, it can couple too much ripple to the FB and affect VOUT regulation. It could also couple too much transient voltage deviation and falsely trip PGOOD thresholds. Therefore, calculate CFF based on output capacitors used in the system. At cold temperatures, the value of CFF might change based on the tolerance of the chosen component. This may reduce its impedance and ease noise coupling on the FB node. To avoid this, more capacitance can be added to the output or the value of CFF can be reduced. See Detailed Design Procedure for the calculation of CFF.

7.3.10 Bootstrap Voltage (BOOT)

The driver of the HS switch requires a bias voltage higher than VIN when the HS switch is ON. The capacitor connected between CBOOT and SW pins works as a charge pump to boost voltage on the CBOOT pin to (VSW + VCC). The boot diode is integrated on the LM43603-Q1 die to minimize the bill of material (BOM). A synchronous switch is also integrated in parallel with the boot diode to reduce voltage drop on CBOOT. A high-quality ceramic 0.47 µF, 6.3 V or higher capacitor is recommended for CBOOT.

7.3.11 Power Good (PGOOD)

The LM43603-Q1 has a built-in power-good flag shown on PGOOD pin to indicate whether the output voltage is within its regulation level. The PGOOD signal can be used for start-up sequencing of multiple rails or fault protection. The PGOOD pin is an open-drain output that requires a pullup resistor to an appropriate DC voltage. Voltage detected by the PGOOD pin must never exceed 12 V. A resistor divider pair can be used to divide the voltage down from a higher potential. A typical range of pullup resistor value is 10 kΩ to 100 kΩ.

When the FB voltage is within the power-good band, +4% above a –7% below the internal reference VREF typically, the PGOOD switch will be turned off, and the PGOOD voltage will be pulled up to the voltage level defined by the pullup resistor or divider. When the FB voltage is outside of the tolerance band, +10% above or –13% below VREF typically, the PGOOD switch turns on, and the PGOOD pin voltage will be pulled low to indicate power bad. Both rising and falling edges of the power-good flag have a built-in 220 µs (typical) deglitch delay.

7.3.12 Overcurrent and Short-Circuit Protection

The LM43603-Q1 is protected from overcurrent conditions by cycle-by-cycle current limiting on both the peak and valley of the inductor current. Hiccup mode is activated if a fault condition persists to prevent over heating.

High-side MOSFET overcurrent protection is implemented by the nature of the peak current mode control. The HS switch current is sensed when the HS is turned on after a set blanking time. The HS switch current is compared to the output of the error amplifier (EA) minus slope compensation every switching cycle. Refer to Functional Block Diagram for more details. The peak current of the HS switch is limited by the maximum EA output voltage minus the slope compensation at every switching cycle. The slope compensation magnitude at the peak current is proportional to the duty cycle.

When the LS switch is turned on, the current going through it is also sensed and monitored. The LS switch is not turned OFF at the end of a switching cycle if its current is above the LS current limit ILS-LIMIT. The LS switch is kept ON so that inductor current keeps ramping down, until the inductor current ramps below the LS current limit. Then the LS switch is turned OFF, and the HS switch is turned on, after a dead time. If the current of the LS switch is higher than the LS current limit for 32 consecutive cycles, and the power-good flag is low, hiccup current protection mode is activated. In hiccup mode, the regulator is shut down and kept off for 5.5 ms typically before the LM43603-Q1 tries to start again. If an overcurrent or short-circuit fault condition still exists, hiccup repeats until the fault condition is removed. Hiccup mode reduces power dissipation under severe overcurrent conditions, prevents overheating, and potential damage to the device.

Hiccup is only activated when power-good flag is low. Under non-severe overcurrent conditions when VOUT has not fallen outside of the PGOOD tolerance band, the LM43603-Q1 reduces the switching frequency and keep the inductor current valley clamped at the LS current limit level. This operation mode allows slight over current operation during load transients without tripping hiccup. If the power-good flag becomes low, hiccup operation starts after LS current limit is tripped 32 consecutive cycles.

7.3.13 Thermal Shutdown

Thermal shutdown is a built-in self protection to limit junction temperature and prevent damage due to overheating. Thermal shutdown turns off the device when the junction temperature exceeds 160°C typically to prevent further power dissipation and temperature rise. Junction temperature reduces after thermal shutdown. The LM43603-Q1 restarts when the junction temperature drops to 150°C.

7.4 Device Functional Modes

7.4.1 Shutdown Mode

The EN pin provides electrical ON and OFF control for the LM43603-Q1. When VEN is below 0.4 V, the device is in shutdown mode. Both the internal LDO and the switching regulator are off. In shutdown mode the quiescent current drops to 1.2 µA typically with VIN = 12 V. The LM43603-Q1 also employs undervoltage lockout protection. If VCC voltage is below the UVLO level, the output of the regulator is turned off.

7.4.2 Stand-by Mode

The internal LDO has a lower enable threshold than the regulator. When VEN is above 1.2 V and below the precision enable falling threshold (1.8 V typically), the internal LDO regulates the VCC voltage at 3.2 V. The precision enable circuitry is turned on once VCC is above the UVLO threshold. The switching action and voltage regulation are not enabled unless VEN rises above the precision enable threshold (2.1 V typically).

7.4.3 Active Mode

The LM43603-Q1 is in active mode when VEN is above the precision enable threshold and VCC is above its UVLO level. The simplest way to enable the LM43603-Q1 is to connect the EN pin to VIN. This allows self start-up when the input voltage is in the operation range: 3.5 V to 36 V. See Enable (EN) and VCC, UVLO, and BIAS for details on setting these operating levels.

In active mode, depending on the load current, the LM43603-Q1 will be in one of four modes:

  1. Continuous conduction mode (CCM) with fixed switching frequency when load current is above half of the peak-to-peak inductor current ripple;
  2. Discontinuous conduction mode (DCM) with fixed switching frequency when load current is lower than half of the peak-to-peak inductor current ripple in CCM operation;
  3. Pulse frequency modulation (PFM) when switching frequency is decreased at very light load;
  4. Fold-back mode when switching frequency is decreased to maintain output regulation at lower supply voltage VIN.

7.4.4 CCM Mode

CCM operation is employed in the LM43603-Q1 when the load current is higher than half of the peak-to-peak inductor current. In CCM operation, the frequency of operation is fixed by internal oscillator unless the the minimum HS switch ON time (TON_MIN) or OFF time (TOFF_MIN) is exceeded. Output voltage ripple is at a minimum in this mode and the maximum output current of 2 A can be supplied by the LM43603-Q1.

7.4.5 Light Load Operation

When the load current is lower than half of the peak-to-peak inductor current in CCM, the LM43603-Q1 operates in DCM, also known as diode emulation mode (DEM). In DCM operation, the LS FET is turned off when the inductor current drops to 0 A to improve efficiency. Both switching losses and conduction losses are reduced in DCM, comparing to forced PWM operation at light load.

At even lighter current loads, PFM is activated to maintain high efficiency operation. When the HS switch ON time reduces to TON_MIN or peak inductor current reduces to its minimum IPEAK-MIN, the switching frequency reduces to maintain proper regulation. Efficiency is greatly improved by reducing switching and gate drive losses.

LM43603-Q1 5V_500k_PFM_Gr.png Figure 45. VOUT = 5 V, Fs = 500 kHz
Pulse Frequency Mode Operation

7.4.6 Self-Bias Mode

For highest efficiency of operation,TI recommends that the BIAS pin be connected directly to VOUT when VOUT ≥ 3.3 V. In this self-bias mode of operation, the difference between the input and output voltages of the internal LDO are reduced and therefore the total efficiency is improved. These efficiency gains are more evident during light load operation. During this mode of operation, the LM43603-Q1 operates with a minimum quiescent current of 27 µA (typical). See VCC, UVLO, and BIAS for more details.

8 Applications and Implementation

NOTE

Information in the following applications sections is not part of the TI component specification, and TI does not warrant its accuracy or completeness. TI’s customers are responsible for determining suitability of components for their purposes. Customers should validate and test their design implementation to confirm system functionality.

8.1 Application Information

The LM43603-Q1 is a step-down DC-DC regulator. It is typically used to convert a higher DC voltage to a lower DC voltage with a maximum output current of 3 A. The following design procedure can be used to select components for the LM43603-Q1.

8.2 Typical Applications

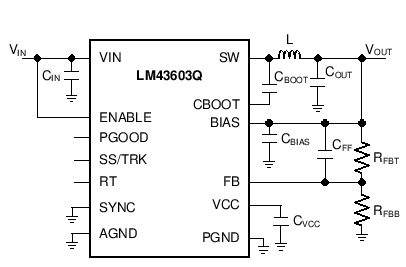
The LM43603-Q1 only requires a few external components to convert from a wide voltage range supply to a fixed output voltage. Figure 46 shows a basic schematic when BIAS is connected to VOUT and this is recommended for VOUT ≥ 3.3 V. For VOUT < 3.3 V, connect BIAS to ground, as shown in Figure 47.

LM43603-Q1 sch_basic01_LM43603Q.png Figure 46. LM43603-Q1 Basic Schematic for VOUT ≥ 3.3 V, tie BIAS to VOUT
LM43603-Q1 sch_basic02_LM43603.gif Figure 47. LM43603-Q1 Basic Schematic for VOUT < 3.3 V, tie BIAS to Ground

The LM43603-Q1 also integrates a full list of optional features to aid system design requirements such as precision enable, VCC UVLO, programmable soft start, output voltage tracking, programmable switching frequency, clock synchronization and power-good indication. Each application can select the features for a more comprehensive design. A schematic with all features utilized is shown in Figure 48.

LM43603-Q1 sch_full_feat_LM43603.gif Figure 48. LM43603-Q1 Schematic with All Features

The external components must fulfill the needs of the application, as well as the stability criteria of the device control loop. The LM43603-Q1 is optimized to work within a range of external components. The inductance and capacitance of the LC output filter must considered in conjunction, creating a double pole, responsible for the corner frequency of the converter. Table 2 can be used to simplify the output filter component selection.

Table 2. L, COUT and CFF Typical Values

FS (kHz) VOUT (V) L (µH)(2) COUT (µF) (1) CFF (pF) (3)(4) RT (kΩ) RFBB (kΩ) (3)(4)
200 1 4.8 600 none 200 100
500 1 2.2 400 none 80.6 or open 100
1000 1 1 250 none 39.2 100
2200 1 0.47 150 none 17.8 100
200 3.3 15 300 470 200 43.2
500 3.3 4.7 150 330 80.6 or open 43.2
1000 3.3 3.3 100 220 39.2 43.2
2200 3.3 1 50 180 17.8 43.2
200 5 18 200 680 200 24.9
500 5 6.8 120 440 80.6 or open 24.9
1000 5 3.3 100 330 39.2 24.9
2200 5 1.5 50 220 17.8 24.9
200 12 33 100 See(5) 200 9.09
500 12 15 50 680 80.6 or open 9.09
1000 12 6.8 44 560 39.2 9.09
200 24 44 47 See(5) 200 4.32
500 24 18 47 See(5) 80.6 or open 4.32
1000 24 10 33 See(5) 39.2 4.32
(1) All the COUT values are after derating. Add more when using ceramics.
(2) Inductance value is calculated based on VIN = 12 V, except for VOUT = 12 V and VOUT = 24 V, the VIN value is 24 V and 48 V, respectively.
(3) RFBT = 0 Ω for VOUT = 1 V. RFBT = 100 kΩ for all other VOUT settings.
(4) For designs with RFBT other than 100 kΩ, adjust CFF so that (CFF × RFBT) is unchanged and adjust RFBB such that (RFBT / RFBB) is unchanged.
(5) High ESR COUT will give enough phase boost, and CFF is not needed.

8.2.1 Design Requirements

Detailed design procedure is described based on a design example. For this design example, use the parameters listed in Table 3 as the input parameters.

Table 3. Design Example Parameters

DESIGN PARAMETER VALUE
Input voltage VIN 12 V typical, range from 3.5 V to 36 V
Output voltage VOUT 3.3 V
Input ripple voltage 400 mV
Output ripple voltage 30 mV
Output current rating 3 A
Operating frequency 500 kHz
Soft-start time 10 ms

8.2.2 Detailed Design Procedure

8.2.2.1 Custom Design With WEBENCH® Tools

Click here to create a custom design using the LM43603-Q1 device with the WEBENCH® Power Designer.

  1. Start by entering the input voltage (VIN), output voltage (VOUT), and output current (IOUT) requirements.
  2. Optimize the design for key parameters such as efficiency, footprint, and cost using the optimizer dial.
  3. Compare the generated design with other possible solutions from Texas Instruments.

The WEBENCH Power Designer provides a customized schematic along with a list of materials with real-time pricing and component availability.

In most cases, these actions are available:

  • Run electrical simulations to see important waveforms and circuit performance
  • Run thermal simulations to understand board thermal performance
  • Export customized schematic and layout into popular CAD formats
  • Print PDF reports for the design, and share the design with colleagues

Get more information about WEBENCH tools at www.ti.com/WEBENCH.

8.2.2.2 Output Voltage Setpoint

The output voltage of the LM43603-Q1 device is externally adjustable using a resistor divider network. The divider network is comprised of top feedback resistor RFBT and bottom feedback resistor RFBB. Equation 11 is used to determine the output voltage of the converter:

Equation 11. LM43603-Q1 eq01_snvsa13.gif

Choose the value of the RFBT to be 100 kΩ to minimize quiescent current to improve light load efficiency in this application. With the desired output voltage set to be 3.3 V and the VFB = 1.015 V, the RFBB value can then be calculated using Equation 11. The formula yields a value of 43.478 kΩ. Choose the closest available value of 43.2 kΩ for the RFBB. See Adjustable Output Voltage for more details.

8.2.2.3 Switching Frequency

The default switching frequency of the LM43603-Q1 device is set at 500 kHz when RT pin is open circuit. The switching frequency is selected to be 500 kHz in this application for one less passive components. If other frequency is desired, use Equation 12 to calculate the required value for RT.

Equation 12. RT(kΩ) = 40200 / Freq (kHz) – 0.6

For 500 kHz, the calculated RT is 79.8 kΩ and standard value 80.6 kΩ can also be used to set the switching frequency at 500 kHz.

8.2.2.4 Input Capacitors

The LM43603-Q1 device requires high frequency input decoupling capacitor(s) and a bulk input capacitor, depending on the application. The typical recommended value for the high frequency decoupling capacitor is between 4.7 µF to 10 µF. TI recommends a high-quality ceramic type X5R or X7R with sufficiency voltage rating. The voltage rating must be greater than the maximum input voltage. To compensate the derating of ceramic capactors, TI recommends a voltage rating of twice the maximum input voltage. Additionally, some bulk capacitance can be required, especially if the LM43603-Q1 circuit is not located within approximately 5 cm from the input voltage source. This capacitor is used to provide damping to the voltage spiking due to the lead inductance of the cable or trace. The value for this capacitor is not critical but must be rated to handle the maximum input voltage including ripple. For this design, a 10-µF, X7R dielectric capacitor rated for 100 V is used for the input decoupling capacitor. The ESR is approximately 3 mΩ, and the current-rating is 3 A. Include a capacitor with a value of 0.1 µF for high-frequency filtering and place it as close as possible to the device pins.

NOTE

DC Bias effect: High capacitance ceramic capacitors have a DC bias effect, which will have a strong influence on the final effective capacitance. Therefore, carefully choose the correct capacitor value. Package size and voltage rating in combination with dielectric material are responsible for differences between the rated capacitor value and the effective capacitance.

8.2.2.5 Inductor Selection

The first criterion for selecting an output inductor is the inductance itself. In most buck converters, this value is based on the desired peak-to-peak ripple current, ΔiL, that flows in the inductor along with the DC load current. As with switching frequency, the selection of the inductor is a tradeoff between size and cost. Higher inductance gives lower ripple current and hence lower output voltage ripple with the same output capacitors. Lower inductance could result in smaller, less expensive component. An inductance that gives a ripple current of 20% to 40% of the 3 A at the typical supply voltage is a good starting point. ΔiL = (1/5 to 2/5) × IOUT. The peak-to-peak inductor current ripple can be found by Equation 13 and the range of inductance can be found by Equation 14 with the typical input voltage used as VIN.

Equation 13. LM43603-Q1 eq03_snvsa13.gif
Equation 14. LM43603-Q1 eq03_snvsa13_L.gif

D is the duty cycle of the converter where in a buck converter case it can be approximated as D = VOUT / VIN, assuming no loss power conversion. By calculating in terms of amperes, volts, and megahertz, the inductance value will come out in micro Henries. The inductor ripple current ratio is defined by:

Equation 15. LM43603-Q1 eq04_snvsa13.gif

The second criterion is inductor saturation current rating. The inductor must be rated to handle the maximum load current plus the ripple current:

Equation 16. IL-PEAK = ILOAD-MAX + ΔiL/ 2

The LM43603-Q1 has both valley current limit and peak current limit. During an instantaneous short, the peak inductor current can be high due to a momentary increase in duty cycle. The inductor current rating must be higher than the HS current limit. It is advised to select an inductor with a larger core saturation margin and preferably a softer roll off of the inductance value over load current.

In general, it is preferable to choose lower inductance in switching power supplies, because it usually corresponds to faster transient response, smaller DCR, and reduced size for more compact designs. But too low of an inductance can generate too large of an inductor current ripple such that over current protection at the full load could be falsely triggered. It also generates more conduction loss, because the RMS current is slightly higher relative that with lower current ripple at the same DC current. Larger inductor current ripple also implies larger output voltage ripple with the same output capacitors. With peak current mode control, it is not recommended to have too small of an inductor current ripple. A larger peak current ripple improves the comparator signal to noise ratio.

Once the inductance is determined, the type of inductor must be selected. Ferrite designs have very low core losses and are preferred at high switching frequencies, so design goals can concentrate on copper loss and preventing saturation. Ferrite core material saturates hard, which means that inductance collapses abruptly when the peak design current is exceeded. The ‘hard’ saturation results in an abrupt increase in inductor ripple current and consequent output voltage ripple. Do not allow the core to saturate!

For the design example, a standard 6.8 μH inductor from Würth Elektronik, Coilcraft, or Vishay can be used for the 3.3 V output with plenty of current rating margin.

8.2.2.6 Output Capacitor Selection

The device is designed to be used with a wide variety of LC filters. Use as little output capacitance as possible to keep cost and size down. Choose the output capacitor(s), COUT, with care because it directly affects the steady state output voltage ripple, loop stability and the voltage over/undershoot during load current transients.

The output voltage ripple is essentially composed of two parts. One is caused by the inductor current ripple going through the ESR of the output capacitors:

Equation 17. ΔVOUT-ESR = ΔiL × ESR

The other is caused by the inductor current ripple charging and discharging the output capacitors:

Equation 18. ΔVOUT-C =ΔiL/ (8 × FS × COUT )

The two components in the voltage ripple are not in phase, so the actual peak-to-peak ripple is smaller than the sum of the two peaks.

Output capacitance is usually limited by transient performance specifications if the system requires tight voltage regulation with presence of large current steps and fast slew rates. When a fast large load transient happens, output capacitors provide the required charge before the inductor current can slew to the appropriate level. The initial output voltage step is equal to the load current step multiplied by the ESR. VOUT continues to droop until the control loop response increases or decreases the inductor current to supply the load. To maintain a small overshoot or undershoot during a transient, small ESR and large capacitance are desired. But these also come with higher cost and size. Thus, the motivation is to seek a fast control loop response to reduce the output voltage deviation.

For a given input and output requirement, Equation 19 gives an approximation for an absolute minimum output capacitor required:

Equation 19. LM43603-Q1 eq_Cout.gif

Along with this for the same requirement, calculate the maximum ESR as per Equation 20:

Equation 20. LM43603-Q1 eq_ESR.gif

where

  • r = Ripple ratio of the inductor ripple current (ΔIL / IOUT)
  • ΔVOUT = target output voltage undershoot
  • D’ = 1 – duty cycle
  • FS = switching frequency
  • IOUT = load current

A general guideline for COUT range is that COUT must be larger than the minimum required output capacitance calculated by Equation 19, and smaller than 10 times the minimum required output capacitance or 1 mF. In applications with VOUT less than 3.3 V, it is critical that low ESR output capacitors are selected. This limits potential output voltage overshoots as the input voltage falls below the device normal operating range. To optimize the transient behavior a feed-forward capacitor could be added in parallel with the upper feedback resistor. For this design example, three 47-µF, 10-V, X7R ceramic capacitors are used in parallel.

8.2.2.7 Feed-Forward Capacitor

The LM43603-Q1 is internally compensated and the internal R-C values are 400 kΩ and 50 pF, respectively. Depending on the VOUT and frequency FS, if the output capacitor COUT is dominated by low ESR (ceramic types) capacitors, it could result in low phase margin. To improve the phase boost an external feedforward capacitor CFF can be added in parallel with RFBT. CFF is chosen such that phase margin is boosted at the crossover frequency without CFF. A simple estimation for the crossover frequency without CFF (fx) is shown in Equation 21, assuming COUT has very small ESR.

Equation 21. LM43603-Q1 eq_fx_3A.gif

Equation 22 was tested for CFF:

Equation 22. LM43603-Q1 eq_CFF.gif

This equation indicates that the crossover frequency is geometrically centered on the zero and pole frequencies caused by the CFF capacitor.

For designs with higher ESR, CFF is not needed when COUT has very high ESR, and CFF calculated from Equation 22 must be reduced with medium ESR. Table 2 can be used as a quick starting point.

For the application in this design example, a 470 pF COG capacitor is selected.

8.2.2.8 Bootstrap Capacitors

Every LM43603-Q1 design requires a bootstrap capacitor, CBOOT. The recommended bootstrap capacitor value is 0.47 μF and rated at 6.3 V or higher. The bootstrap capacitor is located between the SW pin and the CBOOT pin. The bootstrap capacitor must be a high-quality ceramic type with X7R or X5R grade dielectric for temperature stability.

8.2.2.9 VCC Capacitor

The VCC pin is the output of an internal LDO for LM43603-Q1. The input for this LDO comes from either VIN or BIAS (see Functional Block Diagram for LM43603-Q1). To insure stability of the part, place a minimum of 2.2-µF, 10-V capacitor for this pin to ground.

8.2.2.10 BIAS Capacitors

For an output voltage of 3.3 V and greater, the BIAS pin can be connected to the output in order to increase light load efficiency. This pin is an input for the VCC LDO. When BIAS is not connected, the input for the VCC LDO is internally connected into VIN. Because this is an LDO, the voltage differences between the input and output affects the efficiency of the LDO. If necessary, a capacitor with a value of 1 μF can be added close to the BIAS pin as an input capacitor for the LDO.

8.2.2.11 Soft-Start Capacitors

The user can left the SS/TRK pin floating, and the LM43603-Q1 implements a soft-start time of 4.1 ms typically. In order to use an external soft-start capacitor, the capacitor must be sized so that the soft start time is longer than 4.1 ms. Use Equation 23 in order to calculate the soft start capacitor value:

Equation 23. LM43603-Q1 eq02_snvsa13.gif

where

  • CSS = Soft start capacitor value (µF)
  • ISS = Soft start charging current (µA)
  • tSS = Desired soft start time (s)

For the desired soft-start time of 10 ms and soft-start charging current of 2 µA, Equation 23 above yield a soft start capacitor value of 0.02 µF.

8.2.2.12 Undervoltage Lockout Setpoint

The undervoltage lockout (UVLO) is adjusted using the external voltage divider network of RENT and RENB. RENT is connected between the VIN pin and the EN pin of the LM43603-Q1. RENB is connected between the EN pin and the GND pin. The UVLO has two thresholds, one for power up when the input voltage is rising and one for power down or brownouts when the input voltage is falling. Equation 24 can be used to determine the VIN UVLO level.

Equation 24. VIN-UVLO-RISING = VENH × (RENB + RENT) / RENB

The EN rising threshold (VENH) for LM43603-Q1 is set to be 2.2 V (typical). Choose the value of RENB to be 1 MΩ to minimize input current from the supply. If the desired VIN UVLO level is at 5 V, then the value of RENT can be calculated using Equation 25:

Equation 25. RENT = (VIN-UVLO-RISING / VENH – 1) × RENB

Equation 25 yields a value of 1.27 MΩ. The resulting falling UVLO threshold, equals 4.3 V, can be calculated by Equation 26, where EN falling threshold (VENL) is 1.9 V (typical).

Equation 26. VIN-UVLO-FALLING = VENL × (RENB + RENT) / RENB

8.2.2.13 PGOOD

A typical pullup resistor value is 10 kΩ to 100 kΩ from PGOOD pin to a voltage no higher than 12 V. If it is desired to pull up PGOOD pin to a voltage higher than 12 V, a resistor can be added from PGOOD pin to ground to divide the voltage seen by the PGOOD pin to a value no higher than 12 V.

8.2.3 Application Performance Curves

Unless otherwise specified, VIN = 12 V, VOUT = 3.3 V, FS = 500 kHz and room temperature. See below for component values for each VOUT and FS combination.
LM43603-Q1 Sch_1V500k.gif
VOUT = 1 V FS = 500 kHz
Figure 49. Component Values for VOUT= 1 V,
FS = 500 kHz
LM43603-Q1 1V_500k_Reg_Gr.png
VOUT = 1 V FS = 500 kHz
Figure 51. Output Voltage Regulation
LM43603-Q1 12VIN1V500kTran.png
VIN = 12 V VOUT = 1 V
Figure 53. Load Transient 0.1 A to 1 A
LM43603-Q1 Sch_3p3V500k.gif
VOUT = 3.3 V FS = 500 kHz
Figure 55. Component Values for VOUT = 3.3 V,
FS = 500 kHz
LM43603-Q1 3p3V_500k_Eff_Gr.png
VOUT = 3.3 V FS = 500 kHz
Figure 57. Efficiency at Room Temperature
LM43603-Q1 3p3V_500k_Pd_Gr.png
VOUT = 3.3 V FS = 500 kHz
Figure 59. Power Loss at Room Temperature
LM43603-Q1 3p3V_500k_Drop_Gr.png
VOUT = 3.3 V FS = 500 kHz
Figure 61. Dropout Curve
LM43603-Q1 3p3V_500k_PFM_Gr.png
VOUT = 3.3 V FS = 500 kHz
Figure 63. Frequency vs Load
LM43603-Q1 12VIN3p3V500kTran.png
VOUT = 3.3 V FS = 500 kHz
Figure 65. Load Transient 0.1 A to 2 A
LM43603-Q1 Sch_5V200k.gif
VOUT = 5 V FS = 200 kHz
Figure 67. Component Values for VOUT = 5 V,
FS = 200 kHz
LM43603-Q1 5V_200k_Reg_Gr.png
VOUT = 5 V FS = 200 kHz
Figure 69. Output Voltage Regulation
LM43603-Q1 12VIN5V200kTran.png
VOUT = 5 V FS = 200 kHz
Figure 71. Load Transient 0.1 A to 2 A
LM43603-Q1 Sch_5V500k.gif
VOUT = 5 V FS = 500 kHz
Figure 73. Component Values for VOUT = 5 V,
FS = 500 kHz
LM43603-Q1 5V_500k_Reg_Gr.png
VOUT = 5 V FS = 500 kHz
Figure 75. Output Voltage Regulation
LM43603-Q1 12VIN5V500kTran.png
VOUT = 5 V FS = 500 kHz
Figure 77. Load Transient 0.1 A to 2 A
LM43603-Q1 Sch_5V1M.gif
VOUT = 5 V FS = 1 MHz
Figure 79. Component Values for VOUT = 5 V,
FS = 1 MHz
LM43603-Q1 5V_1M_Reg_Gr.png
VOUT = 5 V FS = 1 MHz
Figure 81. Output Voltage Regulation
LM43603-Q1 12VIN5V1MTran.png
VOUT = 5 V FS = 1 MHz
Figure 83. Load Transient
LM43603-Q1 Sch_5V2M.gif
VOUT = 5 V FS = 2.2 MHz
Figure 85. Component Values for VOUT = 5 V,
FS = 2.2 MHz
LM43603-Q1 5V_2M_Reg_Gr_Update.png
VOUT = 5 V FS = 2.2 MHz
Figure 87. Output Voltage Regulation
LM43603-Q1 12VIN5V2MTran.png
VOUT = 5 V FS = 2.2 MHz
Figure 89. Load Transient
LM43603-Q1 Sch_12V500k.gif
VOUT = 12 V FS = 500 kHz
Figure 91. Component Values for VOUT = 12 V,
FS = 500 kHz
LM43603-Q1 12V_500k_Reg_Gr.png
VOUT = 12 V FS = 500 kHz
Figure 93. Output Voltage Regulation
LM43603-Q1 24VIN12V500kTran.png
VOUT = 12 V FS = 500 kHz VIN = 24 V
Figure 95. Load Transient 0.1 A to 2 A
LM43603-Q1 1V_500k_Eff_Gr.png
VOUT = 1 V Fs = 500 kHz
Figure 50. Efficiency
LM43603-Q1 1V_500k_PFM_Gr.png
VOUT = 1 V FS = 500 kHz
Figure 52. Frequency vs Load
LM43603-Q1 1V_500k_Thermal.png
VOUT = 1 V FS = 500 kHz RθJA = 20°C/W
Figure 54. Derating Curve
LM43603-Q1 3p3V_500k_EffLin_Gr.png
VOUT = 3.3 V FS = 500 kHz
Figure 56. Efficiency at Room Temperature
LM43603-Q1 3p3V_500k_Eff85_Gr.png
VOUT = 3.3 V FS = 500 kHz
Figure 58. Efficiency at 85ºC Ambient Temperature
LM43603-Q1 3p3V_500k_Pd85_Gr.png
VOUT = 3.3 V FS = 500 kHz
Figure 60. Power Loss at 85°C Ambient Temperature
LM43603-Q1 3p3V_500k_FreqDrop_Gr.png
VOUT = 3.3 V FS = 500 kHz
Figure 62. Frequency vs VIN
LM43603-Q1 3p3_500k_Reg_Gr.png
VOUT = 3.3 V FS = 500 kHz
Figure 64. Output Voltage Regulation
LM43603-Q1 3p3V_500k_Thermal.png
VOUT = 3.3 V FS = 500 kHz RθJA = 20°C/W
Figure 66. Derating Curve
LM43603-Q1 5V_200k_Eff_Gr.png
VOUT = 5 V FS = 200 kHz
Figure 68. Efficiency at Room Temperature
LM43603-Q1 5V_200k_Drop_Gr.png
VOUT = 5 V FS = 200 kHz
Figure 70. Dropout Curve
LM43603-Q1 5V_200k_Thermal.png
VOUT = 5 V FS = 200 kHz RθJA = 20°C/W
Figure 72. Derating Curve
LM43603-Q1 5V_500k_Eff_Gr.png
VOUT = 5 V FS = 500 kHz
Figure 74. Efficiency at Room Temperature
LM43603-Q1 5V_500k_Drop_Gr.png
VOUT = 5 V FS = 500 kHz
Figure 76. Dropout Curve
LM43603-Q1 5V_500k_Thermal.png
VOUT = 5 V FS = 500 kHz RθJA = 20°C/W
Figure 78. Derating Curve
LM43603-Q1 5V_1M_Eff_Gr.png
VOUT = 5 V FS = 1 MHz
Figure 80. Efficiency
LM43603-Q1 5V_1M_Drop_Gr.png
VOUT = 5 V FS = 1 MHz
Figure 82. Dropout Curve
LM43603-Q1 5V_1M_Thermal.png
VOUT = 5 V FS = 1 MHz RθJA = 20°C/W
Figure 84. Derating Curve
LM43603-Q1 5V_2M_Eff_Gr_Update.png
VOUT = 5 V FS = 2.2 MHz
Figure 86. Efficiency
LM43603-Q1 5V_2M_Drop_Gr.png
VOUT = 5 V FS = 2.2 MHz
Figure 88. Dropout Curve
LM43603-Q1 5V_2M_Thermal.png
VOUT = 5 V FS = 2.2 MHz RθJA = 20°C/W
Figure 90. Derating Curve
LM43603-Q1 12V_500k_Eff_Gr.png
VOUT = 12 V FS = 500 kHz
Figure 92. Efficiency
LM43603-Q1 12V_500k_Drop_Gr.png
VOUT = 12 V FS = 500 kHz
Figure 94. Dropout Curve
LM43603-Q1 12V_500k_Thermal.png
VOUT = 12 V FS = 500 kHz RθJA = 20°C/W
Figure 96. Derating Curve

9 Power Supply Recommendations

The LM43603-Q1 is designed to operate from an input voltage supply range between 3.5 V and 36 V. This input supply must be well regulated and able to withstand maximum input current and maintain a stable voltage. The resistance of the input supply rail must be low enough that an input current transient does not cause a high enough drop at the LM43603-Q1 supply voltage that can cause a false UVLO fault triggering and system reset.

If the input supply is located more than a few inches from the LM43603-Q1 additional bulk capacitance may be required in addition to the ceramic bypass capacitors. The amount of bulk capacitance is not critical, but a 47 µF or 100 µF electrolytic capacitor is a typical choice.

10 Layout

The performance of any switching converter depends as much upon the layout of the PCB as the component selection. The following guidelines will help users design a PCB with the best power conversion performance, thermal performance, and minimized generation of unwanted EMI.

10.1 Layout Guidelines

  1. Place ceramic high frequency bypass CIN as close as possible to the LM43603-Q1 VIN and PGND pins. Grounding for both the input and output capacitors should consist of localized top side planes that connect to the PGND pins and PAD.
  2. Place bypass capacitors for VCC and BIAS close to the pins and ground the bypass capacitors to device ground.
  3. Minimize trace length to the FB pin net. Locate both feedback resistors, RFBT and RFBB close to the FB pin. Place CFF directly in parallel with RFBT. If VOUT accuracy at the load is important, make sure VOUT sense is made at the load. Route VOUT sense path away from noisy nodes and preferably through a layer on the other side of a shieldig layer.
  4. Use ground plane in one of the middle layers as noise shielding and heat dissipation path.
  5. Have a single point ground connection to the plane. Route the ground connections for the feedback, soft-start, and enable components to the ground plane. This prevents any switched or load currents from flowing in the analog ground traces. If not properly handled, poor grounding can result in degraded load regulation or erratic output voltage ripple behavior.
  6. Make VIN, VOUT and ground bus connections as wide as possible. This reduces any voltage drops on the input or output paths of the converter and maximizes efficiency.
  7. Provide adequate device heat sinking. Use an array of heat-sinking vias to connect the exposed pad to the ground plane on the bottom PCB layer. If the PCB has multiple copper layers, these thermal vias can also be connected to inner layer heat-spreading ground planes. Ensure enough copper area is used for heat-sinking to keep the junction temperature below 125°C.

10.1.1 Compact Layout for EMI Reduction

Radiated EMI is generated by the high di/dt components in pulsing currents in switching converters. The larger area covered by the path of a pulsing current, the more EMI is generated. The key to minimize radiated EMI is to identify pulsing current path and minimize the area of the path. In Buck converters,the pulsing current path is from the VIN side of the input capacitors to HS switch, to the LS switch, and then return to the ground of the input capacitors, as shown in Figure 97.

LM43603-Q1 Buck-didt.gif Figure 97. Buck Converter High Δi/Δt Path

High-frequency ceramic bypass capacitors at the input side provide primary path for the high di/dt components of the pulsing current. Placing ceramic bypass capacitor(s) as close as possible to the VIN and PGND pins is the key to EMI reduction.

The SW pin connecting to the inductor must be as short as possible, and just wide enough to carry the load current without excessive heating. Use short, thick traces or copper pours (shapes) for high current condution path to minimize parasitic resistance. The output capacitors must be place close to the VOUT end of the inductor and closely grounded to PGND pin and exposed PAD.

Place the bypass capacitors on VCC and BIAS pins as close as possible to the pins respectively and closely grounded to PGND and the exposed PAD.

10.1.2 Ground Plane and Thermal Considerations

TI recommends using one of the middle layers as a solid ground plane. Ground plane provides shielding for sensitive circuits and traces. It also provides a quiet reference potential for the control circuitry. The AGND and PGND pins must be connected to the ground plane using vias right next to the bypass capacitors. PGND pins are connected to the source of the internal LS switch. They must be connected directly to the grounds of the input and output capacitors. The PGND net contains noise at switching frequency and may bounce due to load variations. Constrain PGND trace, as well as PVIN and SW traces, to one side of the ground plane. The other side of the ground plane contains much less noise and should be used for sensitive routes.

TI recommends providing adequate device heat sinking by utilizing the PAD of the device as the primary thermal path. Use a recommended 4 by 3 array of 10-mil thermal vias to connect the PAD to the system ground plane heat sink. The vias must be evenly distributed under the PAD. Use as much copper as possible, for system ground plane, on the top and bottom layers for the best heat dissipation. Use a four-layer board with the copper thickness for the four layers, starting from the top of, 2 oz / 1 oz / 1 oz / 2 oz. Four layer boards with enough copper thickness provides low current conduction impedance, proper shielding and lower thermal resistance.

The thermal characteristics of the LM43603-Q1 are specified using the parameter RθJA, which characterize the junction temperature of silicon to the abient temperature in a specific system. Although the value of RθJA is dependant on manhy variables, it still can be used to approximate the operating junction temperature of the device. To obtain an estimate of the device junction temperature, one may use Equation 27:

Equation 27. TJ = PD x RθJA+ TA

where

  • TJ = Junction temperature in °C
  • PD = VIN x IIN × (1 - Efficiency) – 1.1 x IOUT × DCR
  • RθJA = junction-to-ambient thermal resistance of the device in °C/W
  • DCR = inductor DC parasitic resistance in Ω
  • TA = ambient temperature in °C

The maximum operating junction temperature of the LM43603-Q1 is 125°C. RθJA is highly related to PCB size and layout, as well as enviromental factors such as heat sinking and air flow. Figure 98 shows measured results of RθJA with different copper area on a 2-layer board and 4-layer board.

LM43603-Q1 TjvsBoard_Gr.png Figure 98. RθJAvs Copper Area
2 oz Copper on Outer Layers and 1 oz Copper on Inner Layers

10.1.3 Feedback Resistors

To reduce noise sensitivity of the output voltage feedback path, it is important to place the resistor divider and CFF close to the FB pin, rather than close to the load. The FB pin is the input to the error amplifier, so it is a high impedance node and very sensitive to noise. Placing the resistor divider and CFF closer to the FB pin reduces the trace length of FB signal and reduces noise coupling. The output node is a low impedance node, so the trace from VOUT to the resistor divider can be long if short path is not available.

If voltage accuracy at the load is important, make sure voltage sense is made at the load. Doing so corrects for voltage drops along the traces and provide the best output accuracy. The voltage sense trace from the load to the feedback resistor divider must be routed away from the SW node path and the inductor to avoid contaminating the feedback signal with switch noise, while also minimizing the trace length. This is most important when high value resistors are used to set the output voltage. TI recommends routing the voltage sense trace and place the resistor divider on a different layer than the inductor and SW node path, such that there is a ground plane in between the feedback trace and inductor/SW node polygon. This provides further shielding for the voltage feedback path from EMI noises.

10.2 Layout Example

LM43603-Q1 layout_rec_snvsa13.gif Figure 99. LM43603-Q1 Board Layout Recommendations


Texas Instruments

© Copyright 1995-2025 Texas Instruments Incorporated. All rights reserved.
Submit documentation feedback | IMPORTANT NOTICE | Trademarks | Privacy policy | Cookie policy | Terms of use | Terms of sale