TIDUE71D March 2018 – April 2020
0.3.2.1 Test Setup
To determine the real performance of the People Counting and Tracking software, test scenarios and test areas have to be created so that the absolute location of people in the room can be compared to the reported location of people in the room. Here, reported location refers to the location reported by the mmWave device. This can be accomplished by carefully marking the test area, then recording each test. This is done as follows:
3.2.1.1 Marking the test environment.
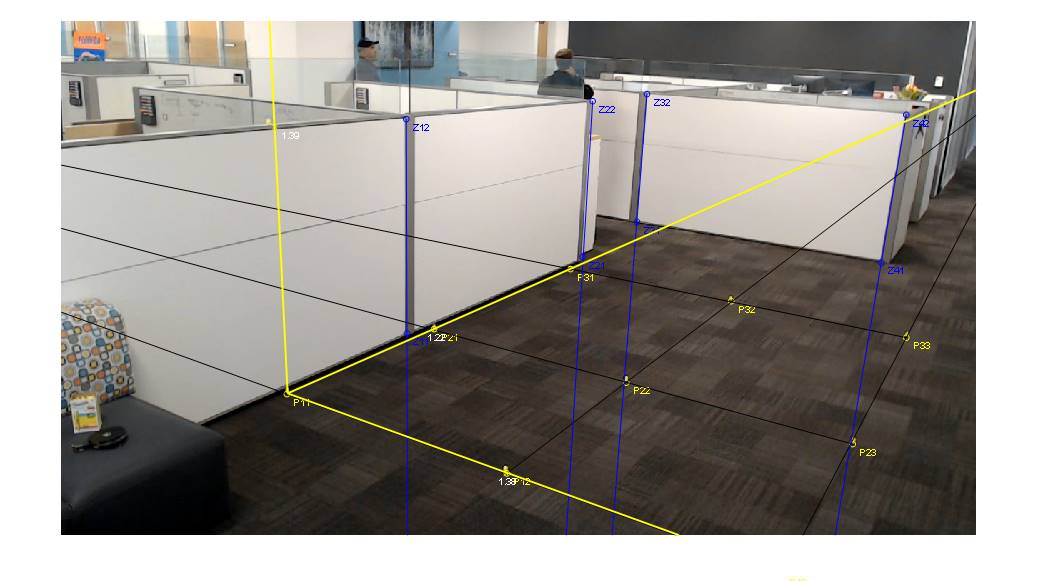
The scene must be marked so that video analysis can accurately estimate the location of people in the room. Once the test environment is decided upon, the tester must create a 3x3 grid on the ground of highly visible markers. The markers should form parallel lines. Setting one of these markers as the origin with location (0, 0, 0), the position of the other 8 markers should be measured. Once the ground plane is complete, another set of markers must be placed above the ground plane. In our example, we use 4 markers, placed directly above markers on the ground plane, so that the X and Y coordinates are the same. Otherwise, the location of the ground directly below these elevated markers must be known. The final scene should look something like this. Note the bright yellow dots on the ground.
Once the markers are placed, the camera position must be selected to see all of the points and the whole intended test area. Once placed, the camera should not be moved. With the location of all markers and the camera known, vanishing lines can be drawn, and the position of people in the scene can be determined.

3.2.1.2 Recording the Test Vector
For each test vector, a camera is used to record the base truth values in the scene, and radar data is captured with the IWR6843ISK and DCA1000. Generally test vectors are 1 to 2 minutres in lenght. During this process, the location and angle of the camera and radar must not change. These should be saved together for later analysis.
3.2.1.3 Analyzing the Test Data
Once all of the data is collected, the location of each person can be determined from the video footage, and compared to the tracker output. To determine location from the video, the location of two pixels must be know
- The pixel near the center of the person's chest
- The pixel where the person's feet touch the ground, below their chest

The test results contain 5 metrics. These include:
- Good Frame Rate (GoodFR or GFR) - this is the percentage of frames with no errors. If you capture 100 frames and a person is missed in 7 frames, the GFR is 93%. If 1 person is missed in 6 frames and 2 people are missed in 1 frame giving 7 frames total with errors, the GFR is still 93%.
- GoodFR1 - Good Frame Rate allowing 1 error. If you collect 100 frames, with 7 frames where exactly 1 person is not tracked, GFR1 is 100% while GFR is 93%
- GoodFR2 - Good Frame Rate allowing 2 errors.
- Miss Detection Rate (MDR) - ratio of missed people vs the total number of people. First, each time a target is present but not detected, increment the miss. You can have more than one miss per frame. Divide this value by the sum of targets in all frames to get MDR
- False Detection Rate (FDR) - ratio of false detection vs the total number of targets detected by the radar module. Each detected target not associated with a real target increments this counter. Divide the counter by the total number of detected targets summed across frames to get this value.
- Positional Error - this is the average error between the absolute position and measured position in meters.